
Ada County Housing Snapshot for January

Brought to you by the Ada County Association of Realtors

Local news that effects you.
Brought to you by the Ada County Association of Realtors

Livability released their second-annual ‘Top 100 Best Places to Live’ for 2015. The rankings include small to mid-sized cities around the US that scored the highest in Livability’s ranking criteria covering amenities, demographics, economy, education, health care, housing, neighborhood data, and transportation.
In the 2014 ‘Top 100 Best Places to Live’ list, Boise, Idaho ranked number 12. However, Boise jumped to the number 9 spot in the 2015 list. Livability found Boise’s cultural and natural amenities and highly ranked schools to be impressive. Also boosting Boise’s score in the 2015 ranking was the city’s affordable housing with the median household income at $49,182 and the median home price at $188,200. See what else Livability said about Boise at http://bit.ly/1zFpzuY
Brought to you by Alliance Title & Escrow Company
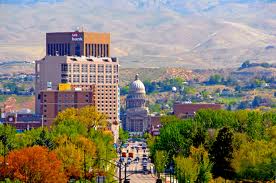
Housing Market Area: The Boise City-Nampa Housing Market Area (HMA), locally referred to as the Treasure Valley, consists of five counties in southwester Idaho–Ada, Boise, Canyon, Gem and Owyhee. The principle counties of Ada and Canyon comprise 95% of the HMA population. Located in Ada County, the city of Boise is the state capital and home to Boise State University. Click the link below to view the details comprehensive analysis.
The Boise City-Nampa Housing Market Area Comprehensive Housing Market Analysis has been published and is available at www. HUDuser.org or by clicking the following link: http://www.huduser.org/portal/publications/PDF/BoiseID_comp_12.pdf.
Home prices within the United States increased 5% in September compared with a year ago—the biggest annual increase since July of 2006. Home prices in Idaho saw the 2nd largest increase in the country which provides even more evidence of a housing rebound.
Balanced price increases should provide momentum to the housing market when homes sales historically pick up in the spring. Rising home prices entice potential buyers to purchase prior to prices rising further and also encourage more homeowners to sell their homes.
Prices have risen in all but 7 states. Homes prices declined in only 18 out of 100 metro areas.
The largest pricing increases were within states that suffered the most during the housing decline. Home prices in Arizona increased 18.6% in the past year—the most of any state. In Idaho, home prices rose 13.1%–the second largest price increase in the nation. Nevada came in 3rd with a home price increase of 11%.
Home builders have begun constructing new homes and apartment complexes at the fastest pace in more than 4 years. More building permits have been issued in 2012 than seen in the past 4 years—a sign that many are confident that the home price increase trend will continue.
Sales of new homes jumped last month to the highest yearly pace in the past 2 ½ years. Sales of both previously occupied and new homes are still below normal levels. Partly because the supply of available homes for sale still is limited along with strict mortgage qualification guidelines.
Prices are continuing to rise. Call me today to discuss taking advantage of the historically low interest rates and home prices!
FORECLOSURE SETTLEMENT–12,207 Idahoans Eligible
Between 2008 and 2011 over 12,000 Idahoans lost their homes to foreclosure and are now eligible for relief through the National Mortgage Settlement.
At a minimum, borrowers which had their home foreclosed upon will receive $840.00 yet the claim amount will vary since the amount of the claim granted will be determined by the amount of claim forms submitted. The settlement totals 24 billion nationwide and includes 5 national banks.
Idaho Attorney General Lawrence Wasden states that “this payment is not intended to compensate Idahoans for the loss of their homes. Rather, it is a step toward accountability for unfair business practices that harmed Idaho homeowners”
The banks which are involved in the settlement are as follows: JP Morgan Chase, GMAC, Citi, Ally and Wells Fargo.
A letter from Attorney General Wasden, claim form and instructions on how to apply for payment will be sent to the 12,207 Idahoans.
The Boise-Nampa Metro Area is in the midst of a real estate market rebound which is evidenced by being rated as one of Nation’s top 10 turn around towns. You will find the Boise along with Pheonix are the only metro areas which received this accolade besides areas within Florida.
Hurry before it’s too late! Home pricing and current interest rates makes this the most affordable time to purchase a home in decades! (78% of homes sold during the first quarter within the US were affordable to those earning the national median income of $65,000, according to a report released Thursday by the National Association of Home Builders and Wells Fargo.)
BOISE LISTED WITHIN “TOP 10 PLACES TO LIVE”
Relocate America announced the top 100 places to live in the United States and our great city of Boise is listed at #8.
RelocateAmerica’s research dvision developed the top 100 places to live after reviewing extensive information on factors which are important within the community: safety, recreaction, the health of the economy and housing. The firm also acquired input from local residents, community leaders and business associates.
They are:
1. Austin, TX
2. Grand Rapids, MI
3. Boulder, CO
4. Raleigh, NC
5. Dallas, TX
6. Greenville, SC
7. Augusta, GA
8. Boise, ID
9. Omaha, NE
10. Oklahoma City, OK
View the entire list of the Top 100 Places to Live for 2011 at:
http://www.relocateamerica.com/2011/08/02/relocateamerica-announces-top-10-cities-for-2011/
Boise ranks w/in the top 3 of CNN/Money Magazines best placed to retire. Contributing to this honor is Boise’s thriving cultural scene which includes an opera company, the philharmonic orchestra, the Morrison Center for the performing arts, ballet, and the Shakespeare Festival. Boise also received high marks for it’s recreational activities (we all know that!).
The TOP 10
1. Marquette, MI
2. Cape Coral, FL
3. Boise, ID
4. Danville, KY
5. Weatherford, TX
6. Southaven, MS
7. Pittsburgh, PA
8. Broken Arrow, OK
9. Lake Charles, LA
10. Winston-Salem, NC
Sales within Ada County have increased 43% in comparison to sales in August of 2010. Typically, August home sales compare evenly with July yet August of 2011 had 7.3% more sales than July of 2011. Year to date, there have been 245 more real estate transactions than in 2010 which compiled a total of 3,947 close transactions (2011 already has 4,192 transactions completed). Is our local market beginning to “mend”?
Forty-five percent of teh3 sales in August of 2011 were distressed—up 3% from the previous month. Distressed sales (bank owned property, HUD and short sales) continue to hinder market performance yet these types of homes for sale are no longer the majority!
The average days for houses for sale in New Tecumseth, Ontario and for homes sold in August was 81 which is down from 90 days last year at this time. Another improvement. Pending sales (homes which have an offer to purchase accepted by both the buyer and seller) decreased 6% from July yet there is an average pending sales number of 900 at the end of the last 3 months—another sign of the extensive recovery at hand.
The amount of homes for sale and available at the end of August fell below 2,500 units for the 1st time since March of 2006 while the percentage of active distressed homes for sale increased almost 2 percent from June to 35%. All of this said, in Ada County there are 4 months of property inventory and historically this exemplifies a “seller’s market”. The pricing category containing the least supply are homes priced fewer than 119K in which there is just 3 months of inventory available. However, consumption of inventory is increasing in all price ranges.
There is good news for home owners that have property w/in the upper echelon of pricing. Homes priced $500,000-$699,999 have seen inventory decreased for the fourth month in a row to 6.9 months.
The local market continues to benefit from inventory levels lower than the average currently contained w/in the United States.
Will inventory levels continue to decrease due to recent hirings? If so, we may see home builders making moves again which would greatly benefit our local economy. I’d love to hear your thoughts . . .
Thinking of taking advantage of historically low pricing and interest rates? Please call me dire ctly at 208-869-3469 in order to discuss your options.